AppManager Dashboard
A new AppManager Dashboard page has been added with Release 5.0 to allow authorized AppManager users the ability to create a personalized user defined reporting and analytics dashboard specific to each AppManager site.
The AppManager “Dashboard” page is accessed by clicking on the Dashboard tab in AppManager.
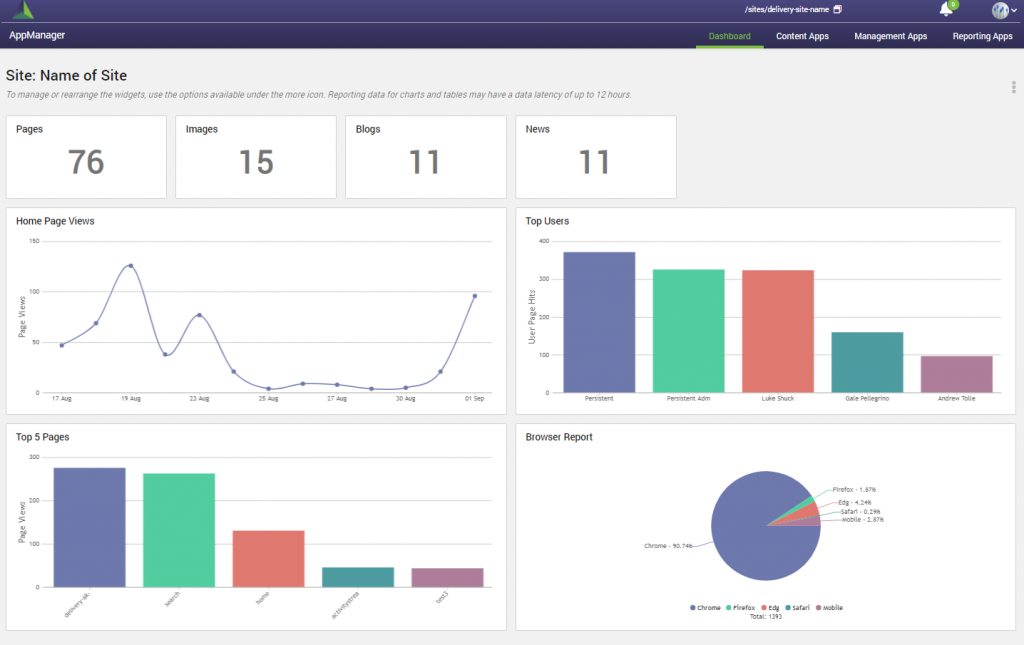
The AppManager Dashboard can be configured differently for each AppManager root site. The active site name displays at the top left of the page, and the statistical and analytic reporting rendered on the dashboard is based on data from the specified list on the current site.
Admin > SharePoint Admin
The AppManager Dashboard Manager Management App is used to control the display and properties of the manage dashboard widget pop-up screens. Click here to learn more about Working with AppManager Dashboard Management App.
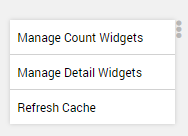
To manage or re-order the widgets on the dashboard, hover over the 3 dotted ellipses (more icon), to select the manage count widgets, select manage detail widgets or refresh cache.
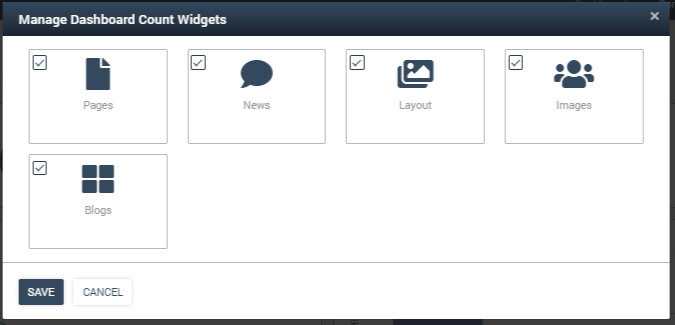
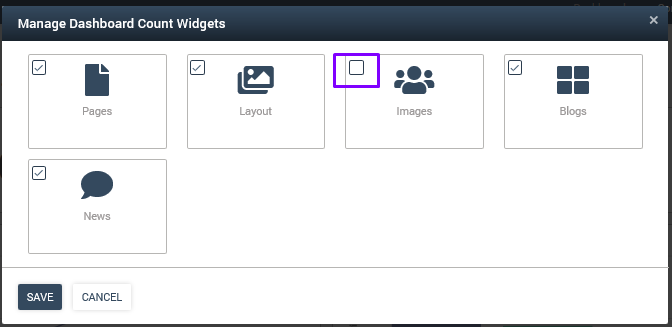
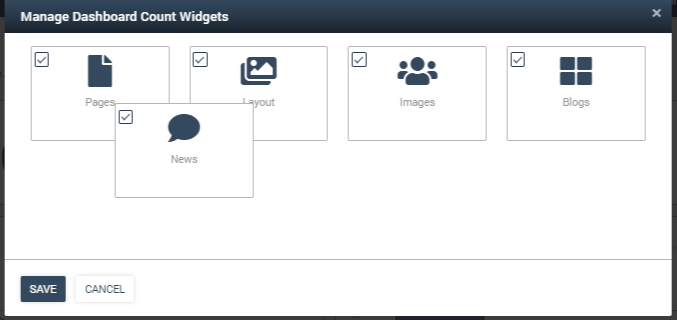
Manage Dashboard Count Widgets
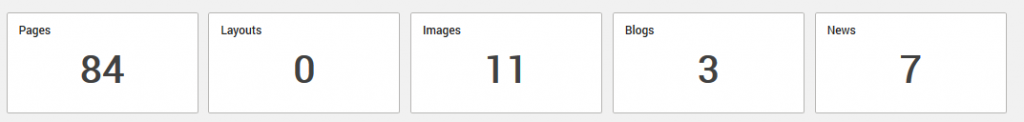
The Dashboard Count Widgets display on the top section of the AppManager Dashboard, when selected. The Count Report Widget provides a statistical count of the items in the specified list based on the widget properties.
The top section of the dashboard includes multiple instances of the Count Report Widget for “Pages”, “Layout”, “Images”, “Blogs”, and “News”. Click here to learn more about the CountReportWidget.
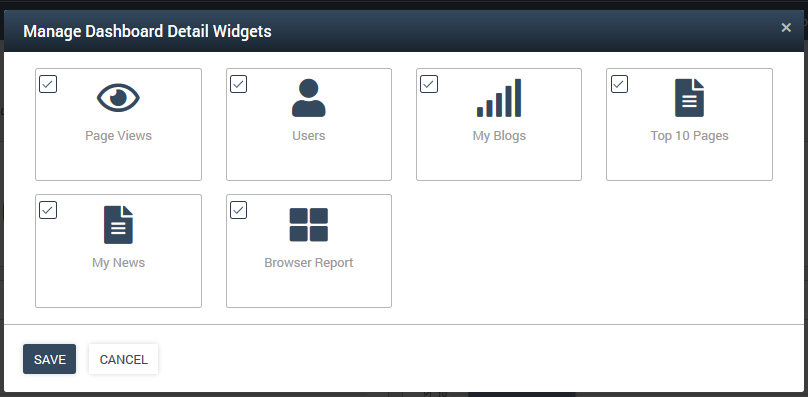
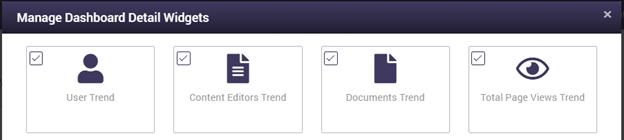
Manage Dashboard Detail Widgets
The Dashboard Detail Widgets display on the main section of the AppManager Dashboard, when selected. The Detail Widgets provide analytics detail data from items in a specified list based on the widget properties.
Standard Default Detail Widgets
The main section of the dashboard has 5 main standard default widgets enabled to display 6 reports:
- Content Report Widget used for “My News” and “My Blogs” to display the corresponding news list of the latest items authored by the current user. Click here to learn more about the ContentReportWidget.
- Top Page Report Widget used for “Top 10 Pages” to display pages with top views on the current site based on app insights data. Click here to learn more about the TopPageReportWidget.
- Top Users Report Widget used for “Top Users” to display the top users based on page hits on the current site. Click here to learn more about the TopUsersReportWidget.
- Page Views Report Widget used for “Home Page Views” to display hits on the page and be configured to point to any page id on the site. Click here to learn more about the PageViewsReportWidget.
- Browser Report Widget used for “Browser Report” to display the browser usage percentage for on the current site. Click here to learn more about the BrowserReportWidget.
Additional Reporting Detail Widgets
In addition to the standard detail widgets, the main section of the dashboard has several optional reporting detail widgets that can be enabled for metrics reporting. Please reference here, for Adding AppManager Widgets to the AppManager Dashboard.
Comment and Reaction Detail Widgets
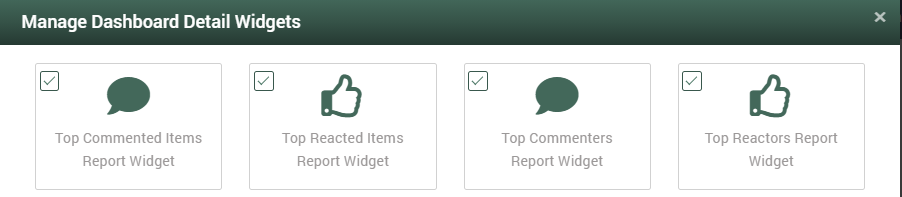
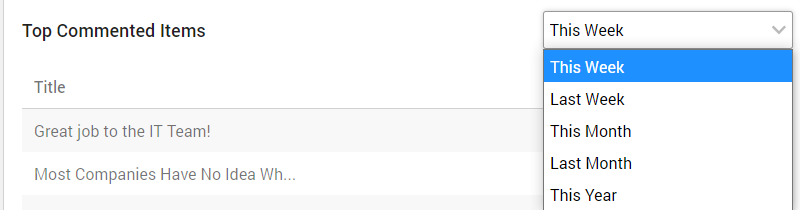
- Top Commented Items Report Widget used for “Top Commented Items” to display a listing of the most commented items in the current site with a count for the specified timespan selected. Click here to learn more about the TopCommentedItemsReportWidget.
- Top Commenters Report Widget used for “Top Commenters” to display a bar graph of the most active users based on comments performed in the current site for the specified timespan selected. Click here to learn more about the TopCommentersReportWidget.
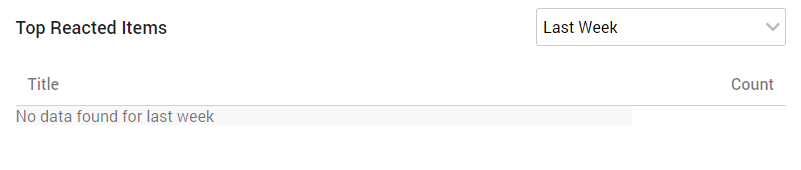
- Top Reacted Items Report Widget used for “Top Reacted Items” to display a listing of the most reacted items in the current site with a count for the specified timespan selected. Click here to learn more about the TopReactedItemsReportWidget.
- Top Reactors Report Widget used for “Top Reactors” to display a bar graph of the most active users based on reactions performed in the current site for the specified timespan selected. Click here to learn more about the TopReactorsReportWidget.
The Comment and Reaction Detail Widgets provide metric reporting for the current site and include a dropdown selector to choose a specified timeframe for the metrics reporting.
When data is not available for the specified period, a message will be displayed “No data found for the time selected in the dropdown.” In this example, the message displays “No data found for last week”.
Trend Reporting Detail Widgets
The Trend Reporting Detail Widgets provide metric reporting for the current site and includes a dropdown selector to choose a specified timeframe or filters to provide the metrics reporting.
- User Trend Report Widget used for “User Trend” to display a bar graph of the number of unique users visiting the current site filtered for the specified date range selected (1 hour, 24 hours, 7 days, 30 days, or 1 year). Click here to learn more about the UserTrendReportWidget.
- Documents Trend Report Widget used for “Top 30 Documents Viewed” to display a listing of up to the top 30 viewed/downloaded documents by modified date in the current site for the specified timespan selected of recent for the last 2 weeks, or lifetime. Click here to learn more about the DocumentsTrendReportWidget.
- Page Views Trend Report Widget used for “Page Views Trend” to display a bar graph of the total number of pages that have been visited in the current site filtered for the specified date range selected (1 hour, 24 hours, 7 days, 30 days, or 1 year). Click here to learn more about the PageViewsTrendReportWidget.
- Content Editors Trend Report Widget used for “Top 50 Content Edit Trend” to display a listing of the top 50 updated articles by modified date in the current site filtered for the date range (1 day, 7 days, 30 days, or 90 days), and the content app selected. Click here to learn more about the ContentEditorsTrendReportWidget.
Top Viewed News Report Widget
The Top Viewed News Report Widget provides reporting on the Foundation News articles in the current site.
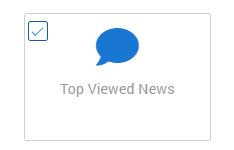
- Top Viewed News Report Widget used for “Top Viewed News” to display a listing of the top 30 viewed news articles in the current site with a count of the number of views, comments, and reactions for each article. Click here to learn more about the TopViewedNewsReportWidget.
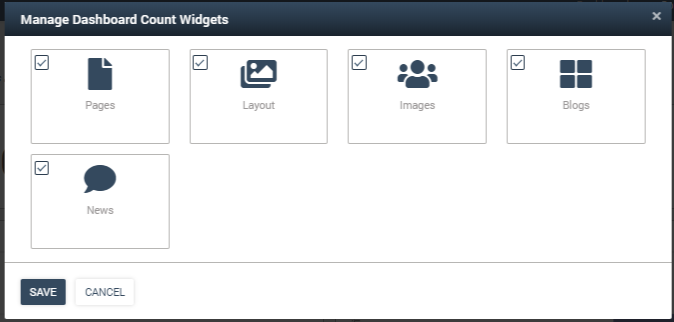
Displaying the AppManager Dashboard Widgets
- Select manage count widgets or manage detail widgets to open the Manage Dashboard Widget Modal.
- Check the widgets to be displayed on the page. Unchecked widgets will not display on the page.
- Click Save.
- The selected (checked) widgets will now appear on your personalized dashboard in the appropriate top or main section.

Re-ordering the AppManager Dashboard Widgets
- Select manage count widgets or manage detail widgets to open the Dashboard widget modal.
- Drag and drop the widgets in the modal to change the order of the dashboard display.
- Click Save.
- The selected widgets will now appear in the new display order on your personalized dashboard in the appropriate top or main section.